Table of Contents
Words of wisdom: “In theory, Imp * Vmp = panel Watts. There's an awful lot in the real world that can affect that.” – Cariboocoot1)
Factors affecting solar panel output
For various reasons it will be a rare event when your panels put out their full rated power. One reason for this is the power needs somewhere to go; unless you are in Bulk stage or are running big loads full power isn't needed so full power isn't generated.
The other big reason is that power ratings are derived from testing under specific lab conditions.2) The standard lab test is at:
- cell temperature of 25C, which would be an ambient temperature of about 0C (freezing). Panel voltage decreases significantly as cell temperature increases.
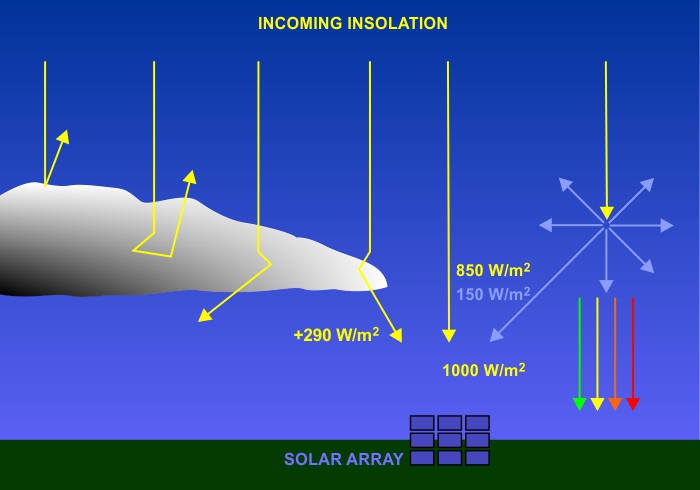
- 1000w of insolation per square meter of panel. That is the amount of sun when the sun is directly overhead on a clear day. Insolation maps will estimate how much sun various regions get.3)
A situation where you might get the panel's rated power (or even a bit more!) would be when the sun is directly overhead on a cold, clear day at high altitude. Least power would be produced on a hot, overcast day when the sun is low on the horizon.
Because the difference between lab and actual conditions is so large, some manufacturers also publish NOCT4) specs, a derated (lowered) set of specs which might or might not be more indicative of what you will see in your use case. NOCT is another tool in the toolbox, not gospel truth.
In practical terms, it's common to see a maximum of 75% of STC under good conditions, more under great conditions, and much less under poor solar conditions. And about half of that in winter.
where and when
The location and season both have profound effects on solar harvest. For example, Phoenix AZ has over 8.5x the amount of solar power available in summer as Seattle WA in the winter. For any given location, winter harvest can tiny compared to summer harvest.
For more specific numbers you can estimate solar harvest using models like PVwatts.
lack of demand
Solar panels do not push power; they respond to the solar charge controller's demand as it tries to meet your present needs. When those needs are minimal (battery already charged, small loads) the controller and panels will be loafing.
Related: is my solar working?
charge controller type
Due to their design, PWM and shunt charge controllers will very rarely allow the panel to run at max output for given conditions. The lower the battery voltage (Vbatt) the lower the panel voltage (Vpanel), therefore the lower the power output.5) The output can be increased somewhat by tweaking battery voltages higher.
MPPT controllers can run the panel at max output when needed, but are much more expensive.
overpaneling
Perhaps counterintuitively, setups with ample panel may see lower peak outputs than smaller setups. This occurs because the overpaneled systems can get the bank charged before local solar noon when maximal harvest can be observed. This is a feature, not a bug. Overpaneled systems are built to meet needs under less-than-optimal conditions. If you want to see Big Numbers, start a huge load at local solar noon under good solar conditions.
wiring losses
Long runs of wire between the panel and controller can result in losses that make the panel appear to be putting out less power. In reality, the lost power has been converted to heat6) in the wiring. Solutions:
- use shorter runs
- use thicker wire
- prefer higher voltage panels
- if multiple panels, run them in serial instead of parallel to decrease carried current
panel temperature
Cell temperature affects the voltage part of the panel's I/V curve; warmer temps drive voltages down and very cold temperatures drive it up. This is why Voc+20% or similar rules of thumb are used when assessing how much voltage “headroom” the solar charge controller has – a cold snap could, for example, put a 48Voc rated array over a 50v controller input limit.
For this reason the array's real-world Vmp is rarely the Vmp given on the lab rating. It doesn't matter much to PWM but you will observe your MPPT finding a Vmp that does not match rated Vmp. And since with MPPT Vmp * Imp = Mpp lower Vmp means lower harvest. Hence the panel mounting airgap; it allows cooling airflow underneath.
high cell temperatures
The data below, derived from this calculator, show power from a 100W mono/poly panel dropping off as ambient temps rise:
| Ambient temp in F | Ambient temp in C | derated power |
|---|---|---|
| 32F | 0.0C | 97w |
| 40F | 4.4C | 95w |
| 50F | 10.C | 92w |
| 60F | 15.6C | 90w |
| 70F | 21.1C | 87w |
| 80F | 26.7C | 84w |
| 90F | 32.2C | 82w |
| 100F | 37.8C | 79w |
| 110F | 43.3C | 76w |
So a snowbird who “chases 60” will be losing ~10% of panel output during the warmest part of the day. Snowbirds chasing 70 will be losing ~13% of panel output.
Note: that radiated heat from the underside of panels can raise temperatures inside the camper.
low cell temperatures
Sub-freezing temperatures can push Voc/Vmp above their rated values. If you will use solar in sub-freezing conditions leave plenty of Voc headroom in your solar charge controller spec. +20% margin is traditional.
zenith angle
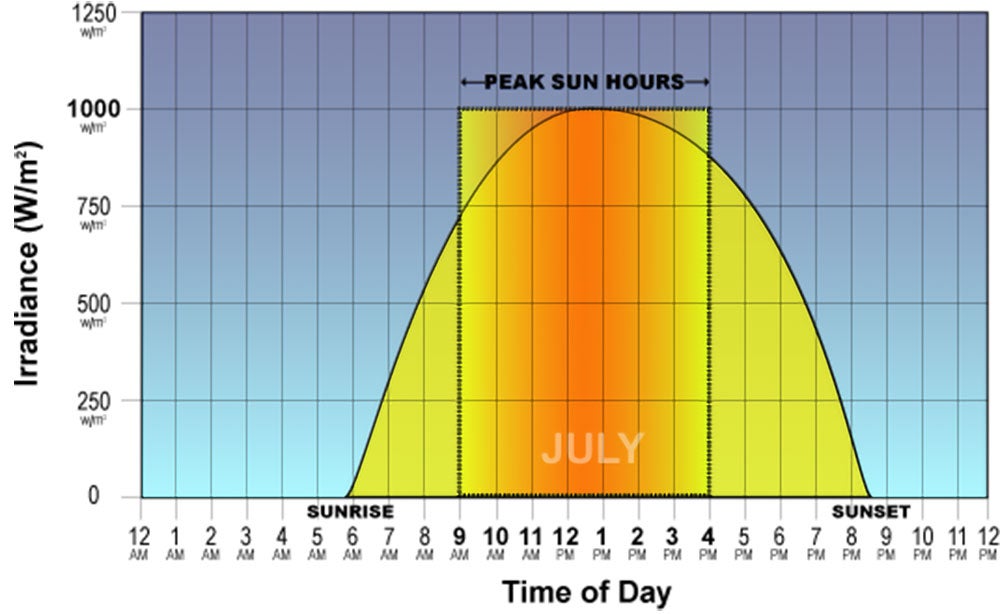
The sun will climb in the sky until it reaches its highest point for the day (local solar noon), then will start dropping again. This affects how much power you can harvest:
For a given latitude and time of day the sun's location in the sky is calculable and can give you the cosine of solar zenith angle (“cosine” hereafter).7). You can use the cosine to understand how much power your system might put out.
Examples: if you have 200w of panels, your mppt controller typically yields 83% after derating, and the calculated cosine is .70 then you might expect ~116w in clear conditions at that time in that location. (200 x .83 x .7 = 116.2).
Another way of thinking about this is that panel ratings are given for 1,000w/meter2. At that time and place only 700w/meter2 land on the panel. (1000 x .70 = 700)
Tip: you can work backwards from cosine calculations and observed power harvests to find your system's overall efficiency in different conditions.
paradox of big solar
All other things being equal, peak harvest will happen at local solar noon8) when the sun is highest in the sky.
This leads to a paradox: some systems with relatively large arrays will have completed Bulk charging before solar noon and so do not have the chance to demonstrate full output. In this scenario a smaller array could theoretically show higher peak output power but could not produce more overall Wh over the course of the day than the larger array.
insolation
Insolation9) is the the amount of solar power reaching the panels. This can be affected by:
- short term
- angle at which rays strikes the panel (angle of incidence) due to time of day. At low angles effectively less panel area is exposed to sunlight.
- amount of atmosphere the rays have to penetrate (less at solar noon, more at other times or anytime sun is relatively lower on the horizon)
- clouds
- rain, fog
- altitude (total irradiance ~+2.67%/1000')12)
- humidity13)
- long term - roughly speaking, you can expect ~half the harvest in winter compared to summer
- solar angle due to time of year.
- hours of seasonal daylight
Even the altitude and type of clouds can affect harvest:
in addition to total sky cover, cloud type is a significant factor in determining the reduction in solar radiation. In particular high, thin cirriform clouds are significantly less effective in reducing solar radiation than are lower, thicker clouds.14)
 Based on lux measurements, we can estimate how sky clarity/brightness affects the amount of power theoretically available to the panel.
Takeaways: overcast skies greatly reduce output, and there is no meaningful power available at sunrise/sunset.
Also see these anecdotal observations.
Latitude affects both the angle (incidence) of sun to the panels and, to a lesser degree, seasonal hours of daylight. Greater latitudes (closer to the north pole for the US) will have lower overall insolation averages than lesser latitudes. They will have more extreme variation in insolation between summer and winter. The most striking example of this is when those regions have 24hr sun in summer and 24hr night in winter.
effects of insolation on power output
 Poor insolation affects panel amps (Ipanel) radically but panel volts (Vpanel) stay stable until insolation is very low (like ⇐20%).
This means any power generated at very low levels of insolation15) will likely be trivial. Increasing panel Voc to try to get more power in marginal conditions may not be effective. Consider overpaneling instead.
using PVWatts to find FSE and daily harvest
this subsection has been moved here
insolation maps
Insolation maps attempt to combine the effects of the variables above to estimate hours of full sun16) equivalent (FSE) per day for large areas. This can be helpful when planning moves around the country.
Areas with atmospheric extremes will be outliers when compared against other locations at their latitude. Oregon and Washing, for example are low insolation outliers because of the famously drizzly weather. Phoenix and the southwest are high insolation outliers because of an unusual percentage of sunny days.
Derated output X FSE
You can multiply your panels' temperature derated output by the hours of full sun equivalent to get an idea of the maximum harvest you can expect from the panels.
Example:
- In April, Salt Lake City has an average high of 61F.
- 100w of panel @ 61F = 90w
- 90w * 5.57hrs = 501.3Wh
- 501.3Wh / 1317) = 38.5Ah produced on average every day.
shade
Partial shade in good sun can have a drastic effect on panel output. This is because panels are made of strings of individual solar cells; having some strings turned “on” and some “off” (to prevent reversing current into the shaded cells) can result in dramatic power reduction.
This effect can be attenuated somewhat by panel design (bypass diodes), parallel rather than serial panel connections when using PWM controllers, use of amorphous (thin-film) panels, and the use serial rather than parallel panel connections of MPPT controllers.
solar magnifiers
 Some conditions can cause an effective magnification of solar power, the opposite of shade in a way. This is usually caused by reflection of previously-uncaptured light onto the panels – the panels are receiving both normal direct light and the additional reflected light at the same time. Since panels are rated at a lab standard 1000w/meter2 , this multiplication of available light can cause the panels to make more than their rated power, and can cause current and/or voltage to rise beyond rated specs.
Examples:
- reflection from bodies of water
- intentional reflection from reflectors (as on a solar farm)
- reflection off snow
- edge-of-cloud effect, where sunlight that would otherwise land far away elsewhere is reflected by clouds “near” the sun onto the panels. This is a relatively rare phenomenon, most often observable in overcast when there is a small break in thick clouds between the sun and panels.
panel tilt
Insolation figures are given for flat surfaces18). This means when the sun is low in the sky19) you may be able to increase solar yield by tilting the panels toward the sun. In effect the panel is more perpendicular to the sun so it can capture maximal solar energy.
Pro:
- optimal tilt will increase harvest when the sun is low and skies are clear.20)
- can be used to further increase harvest if roof space is maxxed (cannot add more panel)
Con:
- setup and takedown time/effort. Tilt might be more practical for people who stay in one place for longer periods rather than moving every couple of days. One's ability to drive off quickly might be impeded.
- with vehicle-mounted panels, the requirement to park at a particular angle in the campsite
- tilt advantage is greatest when available power is least (ie, the sun's position in the sky is lowest), as in winter, high latitudes, morning/afternoon, etc. So if you have a 200w array that averages 75w when the sun is low in the winter adding tilt could make the array behave like a 260w array making 98w.
- tilt has minimal effect when sunlight is indirect (rain, overcast, fog, haze, etc) .
Optimum aiming involves both tracking the suns elevation above the horizon (zenith) and tracking the sun's east-to-west travel (azimuth). Doing both can increase yield ~30% but requires frequent repositioning throughout the day.
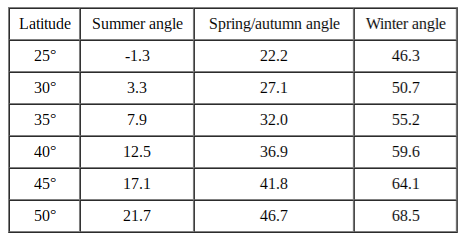
Leaving panel tilt in a reasonable default is more common and has milder yield improvments. In this approach the panel is aimed at true21) south22) at a particular angle from perpendicular23) depending on time of year and latitude.
Tilt angles calculated by solarpaneltilt.com:
30 degrees latitude is near the southern border of the US; 45 degrees latitude is near the northern border.
Further reading:
- results of tilt experiments by Gone With the Wynnes
cleanliness
According to lab testing, dusty panels cause a derating of 5%-6%.
sensitivity to light spectrum
Note: these differences exist but are of little practical effect.
differences in light
- direct sunlight is broad-spectrum (a mix of light wavelengths)
- when the sun is near the horizon the available light is more red (longer wavelengths)
- when skies are overcast or otherwise diffused the available light is more blue (shorter wavelengths)
Since the latter point is counterintuitive:
at visible wavelengths, overcasts are far from spectrally neutral transmitters of the daylight incident on their tops. Colorimetric analyses show that overcasts make daylight bluer and that the amount of bluing increases with cloud optical depth. Simulations using the radiative-transfer model MODTRAN4 help explain the observed bluing: multiple scattering within optically thick clouds greatly enhances spectrally selective absorption by water droplets.24)
differences in panel sensitivity
 Note: visible light is roughly 400-750nm.25). Below that is UV and above that is infrared.
- [redder end]
- CIGS (copper indium gallium selenide) thin-film panels have peak sensitivity around 950nm.
- monocrystalline silicon panels (mono, c-Si) tend to have maximal spectral response around 900nm
- polycrstalline silicon panels (poly, mc-Si,pc-Si)26) slightly lower than mono. We will stipulate 850nm.
- GaAs (gallium arsenide) thin-film panels have peak response around 825nm.
- CdTe (Cadmium Telluride) flex panels, the most popular thin-film type, have peak response around 750nm.
- amorphous silicon panels (a-Si, the original noncrystalline panel) - have peak response around 550nm.
- [ bluer end ]
further information
- What effect does temperature have on solar panels? – AltE YT video
- Blocking and Bypass diodes – AltE YT video
- What effect does shading have on solar panels? – AltE YT video
- How to wire shaded solar panels – AltE YT video

