
electrical:solar:status
Table of Contents
If you want to see lots more amps coming out of the [charge controller], put on a [significant] load… in the middle of a sunny day. – John61CT1)
Is my solar working?
TL:DR
- if the panel voltage shown on the controller is ≤Vmp then the controller is making as much power as it can
- if the panel voltage is >Vmp then the controller is restricting panel power on purpose
- solar only makes power on demand; if the battery is charged and there are no loads then no power will be produced2)
overview
Note: for simplicity's sake this article assumes nominal 12v panels and 12v house power.
It is common for those with new solar configurations to worry about whether or not the solar is working. This is understandable because:
- solar is $$$; and
- solar can seem magical; and
- both poorly running systems and mostly/fully charged systems show low levels of output for different reasons.
The last point may be counterintuitive. A fully charged system is observed to deliver very little power because the bank is already charged; the system is loafing, waiting for a load. It only cranks up power when you add a big load or start charging a depleted battery. With lead chemistry batteries this also applies in Absorption stage, when the battery reduces the amount of current it will accept.
A poorly running system is observed to deliver very little power because it isn't set up right (or is shaded, etc) and can't do any better. Battery voltage is too low3) and doesn't meet needs.
Also counterintuitively, systems with lots of panel start generating usable power so early after sunrise that they can finish bulk charging well before solar noon. This means the user might never see the system at full4) power during normal circumstances.5) This effect is particularly strong when the system is overpaneled.
This page is to help solar beginners tell what their system is doing without special equipment. A battery monitor can be extremely useful but we can tell a great deal without it. The info here is oriented to typical 12v systems with lead-acid battery banks. Folks running other battery chemistries or nominal voltages are assumed to already know what they're doing. ![]()
common issues and non-issues
In rough order from most common to least common
- NON-ISSUE: the battery bank is already charged
- NON-ISSUE: the battery bank was charged in a no-float charging profile and is settling toward the rebulk setpoint
- ISSUE: the panels are shaded6)
- ISSUE: there is a connection issue between the panels and controller (if it worked in the past)
- ISSUE: the panels are incorrectly spec'ed for the controller or wired in a way to make it so (probably has never worked)
the gory details
numbers rather than icons or lights
Icons and blinking lights are often misleading or oversimplied. Tracer/Renogy controllers are infamous for confusing battery graphics. Others like the Victron 75/15 accurately show which charging stage is running.
Measurements, on the other hand, are useful when we learn how to read them.
first collect a few numbers
To tell at a glance what your system is doing you need to find a couple pieces of info about your system. You will only have to look them up once; it might be worthwhile to write them down on a sticky note near your solar gear.
panel specs
The specs we are interested in are:
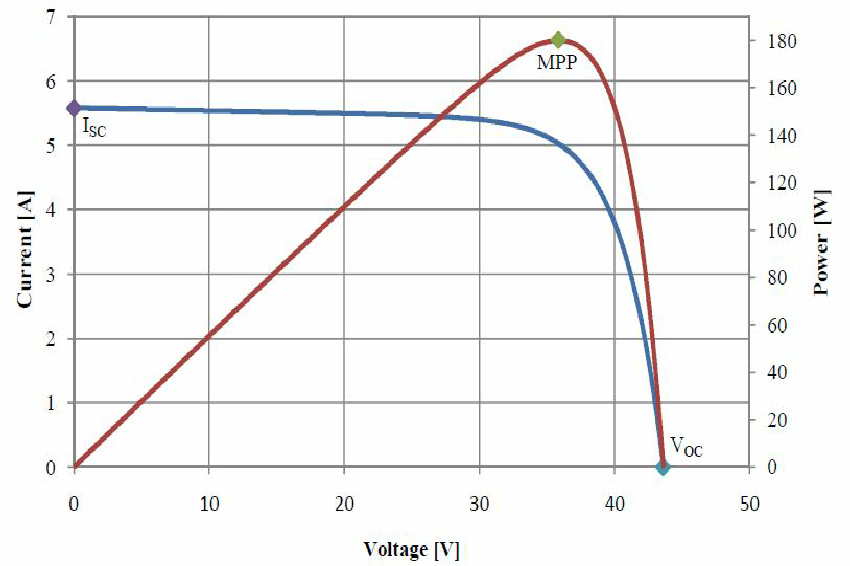
- Vmp, the voltage at which the panel makes max power under laboratory conditions7)
- Voc, the highest voltage the panel will put out under normal cirumstances. At Voc the panel produces no current and therefore no power (Voc x 0A = 0W)
- when in use, Vpanel is the panel voltage reported by the controller. PWM controllers might not report this value.
On the curve pictured at the right Vmp is at the peak of the red voltage line, and Voc is on the far right where output crashes to 0W.
controller
- Vfloat the charge controller's Float setpoint
- Veq the charge controller's Equalization setpoint, if any
If you have an MPPT controller also look up these pieces of info:
- Vmp - the voltage at which your panel makes maximum power. This will be stated in the specs and on the label on the back of your panel. For so-called 12v panels this is usually around 17-19v.
- Voc - the voltage of the panel at open circuit (“unconnected”). This will be higher than Vmp, probably in the low 20s. Found in the same place as Vmp.
then observe the controller
These checks are admittedly crude but will help see if your system is getting it done. No expensive or specialized equipment is required.8) MPPT controllers in particular will reveal a great deal of information by how they interact with the panels. For the purposes of this article, consider single-stage/shunt controllers to work the same way as PWM except they only have one voltage setpoint.9)
For the examples below we will assume the system is set up this way:
Vabs 14.6v


Vfloat 13.8v


Vmp 17v


Voc 20v
In addition,
Vpanel - measured voltage of panel output


Vbatt - measured voltage of battery bank
in bulk
During bulk charging with MPPT
- Vpanel == Vmp10)
- Vbatt climbing toward Vabs
- charge delivered to battery holds steady11) Note: in a lab environment with DC power supplies the current (measured in Amps) could stay steady as the battery approaches Vabs.12) When charging off-grid we are typically limited by charging wattage, say 300w from the alternator or panels. At 12.1v you would see ~25A charging (300w/12.v = 24.79A) but at 14v you'd only see ~21.5A (300w/14v = 21.43A)
- Example: Panel voltage at Vmp == 17v, battery voltage 12.9v and rising, controller output steady-ish at 4A.
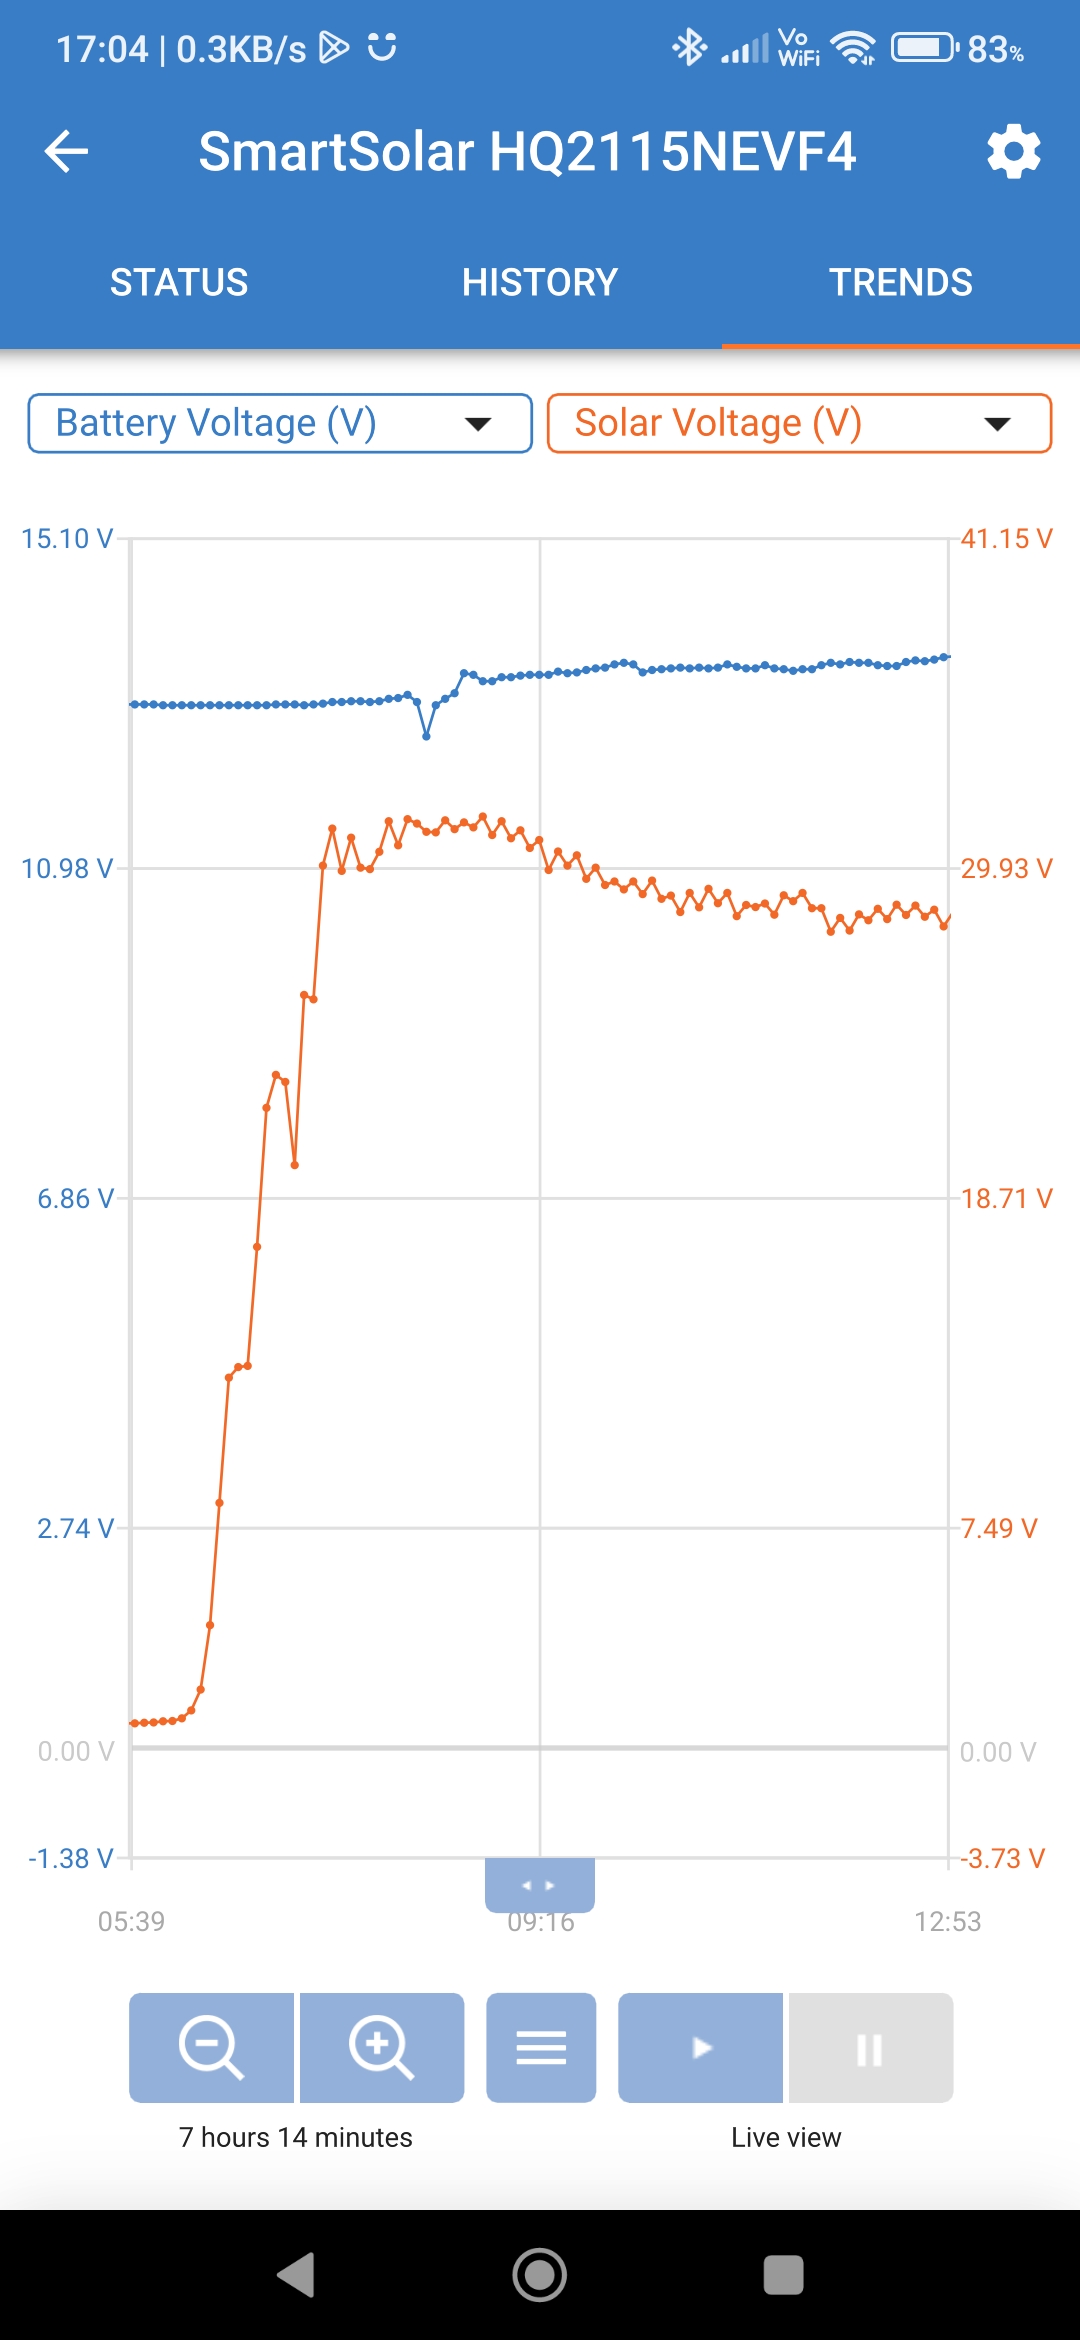
- Note: while MPPT will ride Vmp during Bulk, Vmp will likely decrease somewhat as the day warms up and the cells derate. See the orange Vpanel line in this screenshot.
During bulk charging with PWM
in absorption
During Absorption charging batteries will need less and less current.
with MPPT controllers
- Vpanel starts to creep up from Vmp toward Voc
- Vbatt == Vabs until the controller's criteria for ending absorption is met
- Controller output decreasing as current demand drops.
- Example: Panel voltage 17v and rising, battery voltage held at Vabs == 14.6v, controller output amps 2A and dropping
with PWM controllers
- Vpanel starts to creep up from Vbatt toward Voc (the more OFF15) switching the closer to Voc) criteria for ending absorption is met
- Controller output decreasing as current demand drops.
- the controller may get warmer as current demand drops16)
- Example: Panel and battery voltage held at Vabs == 14.6v, controller output 2A and dropping
transitioning to float
When transitioning from Absorption to Float the voltage needs to drop about a volt. The system will “free-fall” (make little or no power) to allow the voltage to fall.17) The transition may take seconds or minutes, depending battery chemistry and how/if the system is loaded.
- Vbatt starts at Vabs
- power harvest is cut off or greatly curtailed (Vpanel spikes toward Voc)
- Vbatt drops to Vfloat
- when Vbatt reaches Vfloat the system will start making power to hold that setpoint.
setups with no float
Configurations with no float (“charge and stop”, found on some Lithium profiles) will
- charge to the Absorption (“boost”) setpoint18)
- stop charging
- until voltage falls to the rebulk (“reboost”, “boost return voltage”) setpoint
- repeat
The fall to reBulk looks like the transition to Vfloat described above. In both cases the controller makes no (or practically no) power until the lower setpoint is reached. Lithium self-discharge is so minimal that unless a load is imposed it might not hit the rebulk setpoint and restart charging until the next morning.
A constant cycling 14.4v→13.2v→14.4v might seem extreme but in practice there is little actual cycling occurring. A fully-charged 4S LFP with no loads will rest somewhere around 13.6v. So for actual SoC changes we are talking about the difference between 13.6v and 13.2v. With significant loads applied 13.2v observed could mean SoC as high as 90% and with trivial loads as low as 70%.19) In normal use the real cycling might be 100%→85%-100% and the solar is helping carry the loads during charging periods.
Renogy confusion
By default Renogy Li profiles work this way, and cause much concern for Renogy users who have not read their manuals and/or who are not familiar with how solar charge controllers / chargers work. [The required information is present in the manuals but Renogy really should spell it out for first-timers. – secessus]
- Rover series - the table on page 37 of the manual shows there is no boost duration and no float in the Li profile. The “boost return voltage” field shows 13.2v.
- DCC-series DC-DC/MPPT combo charger - the table on page 2 of the manual shows there is no boost duration and no float in the Li profile. The “boost return voltage” field shows 13.2v.
- RBC40D1S - the table on p11 of the manual shows there is no float and it rebulks (“recharging”) at 13.6v.
- DC-DC charger (20A/40A/60A)
- page 18 says “lithium batteries will only have an absorption charge and no float charge”
- there is no setting for Float charge, as shown in the table on page 17 of the manual and it says “for lithium… there will not be a float voltage”
- page 18 says that Float is for lead only
- the manual does not state the 13.2v boost return setpoint [an egregious error - secessus]
Users uncomfortable with this behavior can set up the USER profile to meet their needs, including defining a quasi-Float setpoint.20)
in float
During Float with MPPT
- Vpanel closer to Voc
- Vbattery == Vfloat
- controller output minimal21)
- Example: Panel voltage held steady at 19.8v (near Voc), battery voltage holding at Vfloat == 13.8v, controller output < 1A
During Float with PWM
when adding loads
Adding a load can help reveal how much untapped power your system can access, and also prove that your system is working.
When adding loads to MPPT during absorption (or float)
- Vpanel drops down closer to Vmp again to increase power to meet the load
- Vbatt held at Vabs (or Vfloat) setpoint if possible
- If max power is required Vpanel will be Vmp.24)
- If demand outstrips supply Vbatt will drop while Vpanel stays pinned at Vmp.
- Example: Upon adding load, the controller starts hunting (tracking) a panel voltage that will meet the load; this will be closer to Vmp. Current output spikes to meet load demand.25) Output is limited by what the panel can provide under present conditions.
When adding loads to PWM during absorption (or float)
or use some traditional rules of thumb
These are general targets to ensure the system is working at the bare minimum to meet your needs. They give a big picture but no information about what is happening at a particular moment.
morning
Are your batteries at a reasonable state of charge in the morning?31) If so, continue to Afternoon.
If not, address this issue soon because discharging too deeply will damage the batteries. Consider these changes:
- increase your Vfloat and Vabs setpoints. Increasing Vabs to the manufacturer's max will help get the battery fully charged. If running PWM this will also allow the system to generate more power.
- run your loads through a low voltage disconnect so they turn off before hurting your bank
- consider reducing your nighttime loads; charge devices like phones and tablets when the system has excess power.
- [And stop running things off an inverter! – secessus]
afternoon
Are your batteries starting Absorption by noon-ish and completing Absorption by late afternoon?32) If so, continue to the next step.
Note: You can tell your batteries are in Absorption because the bank will be at Vabs, the controller's absorption setpoint.
If not, delay running heavier loads until Absorption is underway.
evening
Are you hitting sundown with at least 12.6-12.7v33) in your lead acid bank?34) If so, you can relax; your system is working well enough.
If not, either we are not harvesting enough power or we are using too much. Stop running heavier loads when the controller can no longer hold Vfloat.
sudden voltage spikes
If you are seeing sudden voltage spikes and have lithium batteries, you may be seeing the BMS disconnect the charging circuit. When this happens the controller suddenly finds itself making too much power (the charging demand suddenly disappeared); voltage on the rest of the circuit will spike while the controller reacts to the new demand level.
The fix, described in the link above, is to charge at a lower voltage that does not antagonize the cells and trip the BMS.
MPPT tracking sweeps
 An MPPT controller must sweep the Power Points along the array voltage curve in order to Track the Maximum (and non-maxiumum) power points. Basically the controller is asking “How much power does it make here on the curve? And here? And over here?” It tracks (remembers) these power points and can return to them as needed. But solar conditions are always changing so the power point data can get stale quickly and the controller has look again from time to time.
Depending on the algorithm the sweep may a small one near presentVpanel, it may be a full sweep from 0v-Voc, or anything in between. It may happen often or seldom. Victron famously makes a sweep every 10 minutes, resulting in visible dips in the app's graphs (see orange line on image at right).
The sweep will interfere with power production so the mfg attempts to find a balance between
- constant production, and
- learning whether or not one is operating at the optimal power point for present conditions
2)
where would it go?
3)
<12.1v
6)
don't do that
7)
likely lower in reality
8)
but use them if you have them!
9)
Absorption OR Float
10)
although temperature derating will cause Vmp to drop
11)
assuming sunlight holds steady
12)
the charger would get more and more wattage from the wall socket
13)
this is because panels are run at battery voltage when using PWM controllers
14)
Vpanel is climbing nearer to Vmp
16)
percentage of time the PWM circuit is turned OFF increases
17)
with MPPT controllers you may see Vpanel go quite close to Voc
18)
with or without some amount of Absorption duration
19)
with trivial loads there might be only 1 cycle a day since voltage would not fall to reBoost
20)
low temp charging cutoff, when available, may only be available in canned Li profiles
24)
can vary due to local conditions
25)
, 29)
this is reflected in either battery charging amps or load amps depending on how the loads are wired
26)
by reducing the OFF timeslices in the PWM circuit, perhaps until the panel and battery are 100% connected at full output
27)
as PWM switching reduces in frequency.
28)
causing a bit of a “death spiral”, as PWM produces less power as panel voltage drops
30)
almost certainly less than what the panel could put out at Vmp
31)
≥50% or ~12.1v for lead batts, ≥20% for Lithium
32)
depending on charging voltage and current Lithium may require no absorption at all to reach 100% SoC
33)
depending on your particular battery
34)
~13.2v for LiFePO4
electrical/solar/status.txt · Last modified: 2024/08/22 21:22 by frater_secessus
affilliate disclosure | the RVwiki runs on a virtual server from NetCup
Except where otherwise noted, content on this wiki is licensed under the following license: CC Attribution-Noncommercial-Share Alike 4.0 International
